
Tourism HR Canada has released their latest Canadian Tourism Labour Market Snapshot Tourism reporting that employment saw positive gains this July, growing to 2,034,400 workers (representing a month-over-month increase of 106,300 or 5.5%). The sector’s total labour force grew to 2,108,900 (a nearly identical increase of 106,300 or 5.3%). This marks the first time since February 2020 that monthly tourism sector employment has topped the 2 million mark—which it had consistently done pre-pandemic, throughout 2018 and 2019.
Full article at: https://tourismhr.ca/2022/08/08/tourism-employment-tops-2-million-but-hiring-challenges-continue/
]]>
30 beer-infused recipes will help showcase local craft brewers across Nova Scotia
FOR IMMEDIATE RELEASE JULY 27, 2022
Halifax, Nova Scotia: Seasoned Plate Culinary Ltd. today announced a new collaboration with The Craft Beer Association of Nova Scotia (CBANS). This partnership will see the development of the 2022 Pints & Plates guide, a compilation of 30 customized beer-infused recipes and pairings developed by Chef Stephen Barrett from Seasoned Plate.
The guide will help showcase local Nova Scotian breweries during a busy and pivotal 2022 tourist season. Like all Nova Scotians, craft brewers have been hit hard by the pandemic and are facing a long road ahead to recovery. As major tourist destinations, local craft breweries can play a big role in helping locals and tourists alike to discover new corners of the province.

The 2022 Pints & Plates guide aims to highlight exceptional beers crafted with artistry and know-how by passionate brewers and demonstrate how to incorporate local craft beer into approachable yet tantalizing meals. The recipes will be combined with other media assets to form an engaging multi-platform campaign that can be followed at www.nscraftbeer.ca, www.seasonedplate.ca, or on social media @seasonedplate and @nscraftbrewers
“Nova Scotia is home to some of the country’s most sensational breweries,” says Chef Stephen Barrett, CEO & President at Seasoned Plate. “Our goal is to help you discover your next favourite Nova Scotian beer and some new and unexpected ways to enjoy it!”
“There are so many different kinds of beer now; all flavours and really, there is one for every taste,” says Debbi MacDonald, Executive Director at the Craft Beer Association of Nova Scotia. “Having such a diverse assortment of award-winning beer and incorporating it into amazing menu ideas that home chefs can prepare themselves, is in itself a winning combination. But a specialized recipe for each brewery incorporating a beer you might not have even thought to try before, well there is the adventure! And this is clearly a Nova Scotian culinary adventure!”
For more information contact:
| Mike Reithmeier Chief Marketing Officer, Seasoned Plate 902-817-8214 mike@seasonedplate.ca |
Debbi MacDonald Executive Director, CBANS 902-623-1675 debbi@nscraftbeer.ca |
About Seasoned Plate: Since 2015, Seasoned Plate has been showcasing high-quality local food and drink with reviews, and expert analysis from Chef Stephen Barrett. Stephen attended culinary school in Melbourne, Australia and now calls Halifax, NS home. He regularly appears on CTV Morning Atlantic, was featured as a Guest Chef at the 2021 Prince Edward Island Fall Flavours event and was recognized as the Influencer of the Year by the Restaurant Association of Nova Scotia in 2019.
About Craft Beer Association of Nova Scotia: CBANS is a broad Association representing most of the 70+ provincial small brewers, allowing them to speak in a unified voice. CBANS helps build industry relationships, works constructively with government and crown corporations, and strives to promote a thriving local industry that benefits all areas of the province.
]]>Responding to the Labour Challenge in Atlantic Canada’s Accommodations Industry
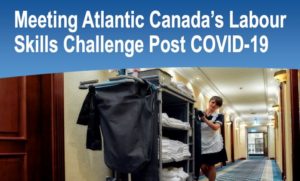
The accommodations industry plays a key role in supporting overnight business and leisure travel for the tourism industry. The industry accounted for over $500 million in real Gross Domestic Product (GDP) for the Atlantic region in 2021. It employed about 10,000 people, 32% below its pre-pandemic level of over 14,000.
Job vacancies in Nova Scotia and New Brunswick’s accommodations industries totaled 900 in third quarter 2021. Data for Prince Edward Island and Newfoundland and Labrador are unavailable. Employers reported major challenges finding cooks and light-duty cleaners. The accommodations job vacancy rate for Nova Scotia and New Brunswick was much higher than other industries at over 9%, compared with over 4% for the overall economy. APEC estimates that the largest occupations in the accommodations industry will need over 29,000 new employees by 2030.
How will employers fill these positions and retain their existing workers? What is the potential for automation in this industry? How will education and training models need to adjust? Also, how can policy makers facilitate the necessary labour market adjustments?
This report is one of three deep dives on select sectors in the Atlantic region. These sectors have been chosen for some of their unique characteristics. The accommodations industry is an example of a highly seasonal, relatively low-wage industry that has a high proportion of female workers. Occupations in this industry typically require modest education and training. While there are large employers in urban centres, there are many smaller employers in towns and rural communities throughout the region.” Click image below to view full Report.
About the Data:
APEC’s report uses data on the accommodations industry where available but reports data on the broader accommodations and food services industry where necessary. Many hotels operate restaurants within their building.
Occupations in the accommodation industry are classified under many different National Occupational Classification (NOC) codes. This report focuses on food service managers (NOC 631), accommodations service managers (NOC 632), chefs (NOC 6321), cooks (NOC 6322), servers (NOC 6513), front desk clerk (NOC 6525), kitchen helpers (NOC 6711) and light duty cleaners (NOC 6731). These occupations have a large representation within the industry and are experiencing serious labour shortages. Some of these occupations are also found in other industries, such as the food services industry.
This report is based on APEC’s analysis of publicly available data and reports. It also incorporates information from interviews with businesses, industry associations and training institutions.
Source –
July 2022 Report on Meeting Atlantic Canada’s Labour Skills Challenge Post COVID-19
APEC is the source for independent research, insights and ideas vital to supporting a healthy, inclusive and sustainable Atlantic Canadian economy.
APEC • info@apec-econ.ca • www.apec-econ.ca • @APECatlantic
]]>1. Travel-Related Measures: A summary of the travel and tourism-related measures in place in each province and
territory. Current travel restrictions and self-isolation requirements are also available on Destination Canada’s
website: https://caen-keepexploring.canada.travel/covid-19-traveller-guidance
2. Methodological Notes: An explanation of the methodologies in the different sections and relevant sources.
1. TRAVEL-RELATED MEASURES
Please consult the Government of Canada website for the latest federal travel requirements: https://travel.gc.ca/travelcovid. Below is a summary of recent updates to federal travel requirements and advice:
As of December 21, pre-arrival testing is required for all travellers entering Canada, regardless of the length of
trip. In addition, all fully vaccinated travellers arriving by air, including Canadian citizens and permanent residents,
may be subject to arrival testing. Fully vaccinated travellers will be required to quarantine while they await the
results of their arrival test.
The Public Health Agency of Canada is advising travellers, regardless of their vaccination status, to avoid nonessential travel internationally.
Travellers aged 12 years and older, with very limited exceptions, are required to show their Canadian COVID-19
proof of vaccination to depart from Canadian airports, on VIA Rail and Rocky Mountaineer trains, and on nonessential passenger vessels (e.g. cruise ships) on voyages of 24 hours or more departing from ports in Canada.
To qualify as fully vaccinated, travellers must have received the full series of an accepted COVID-19 vaccine (or a
full series of a combination of accepted vaccines), with the last dose at least 14 full days prior to the date of travel.
In addition to federal government travel requirements, individual provinces and territories have implemented measures on
travel between provinces and territories. The table below outlines self-isolation requirements for domestic and foreign
travellers entering into each province or territory, as well as restrictions on travel across provincial and territorial borders.
Tracking these measures is challenging given the fluid nature of COVID-19. This information, collected by provincial and
territorial tourism marketing authorities and relevant tourism departments, is current as of January 13, 2022

View Latest Report:
https://www.destinationcanada.com/…/COVID-19%20Canada%20Tra…
Resident Sentiment Opinion:
https://www.destinationcanada.com/…/Resident%20Sentiment%20…
Despite ongoing restrictions, tourism gained employment in May, adding 45,800 workers. There were gains in full-time employment offset to a degree by declines in part-time employment. Tourism employment increased in all provinces except for Nova Scotia, where employment fell by 2,200 jobs.
Seasonally unadjusted employment across all industries increased by 288,700. Once again there is a large discrepancy between the unadjusted and adjusted data. Despite these gains, the seasonally adjusted data shows an employment loss of 68,000. Essentially, because the economy did not add as many jobs as it usually does in May. Applying seasonal adjustments results in a decrease. The data collected was for the week of May 9th to 15th.
The seasonally unadjusted tourism unemployment rate decreased from 11.3% to 9.8%. In April the unemployment rate had dropped from 13.0% to 11.3%.
This will partially be due to the increase in employment. But our stakeholders should also be aware that Statistics Canada only links unemployed workers to their former industry for one calendar year. After that, they are counted as unclassified. Due to this the tourism unemployment rate—and by extension the unemployment rate for any industry—should be used with caution. The decreasing unemployment rate does not necessarily mean that tourism workers who have been unemployed for over a year have found a new job, or dropped out of the labour force.
There were a mix of employment gains and losses by industry this month.
| Industry Group | Employment Change | Full-time Employment | Part-time Employment |
| Accommodations | 900 | 700 | 200 |
| Food and Beverage Services | 24,600 | 34,300 | -9,600 |
| Recreation and Entertainment | 27,200 | 24,400 | 2,800 |
| Transportation | -6,300 | 3,300 | -9,600 |
| Travel Services | -600 | -1,400 | 800 |
Compared to last year there have been significant employment gains. Last May a few businesses that could were starting to reopen, but for the most part the economy was still shutdown. It will only be in June, and more so in July when comparing monthly data for 2020 and 2021 becomes useful.
Compared to May 2019, employment in all industry groups remains well below what it should be.
| Industry Group | Employment Change – May 2020 to 2021 | Percent Change May (2020 to 2021) | Employment Change – May 2019 to 2021 | Percent Change May (2019 to 2021) |
| Accommodations | 10,900 | 10.6% | -66,200 | -36.7% |
| Food and Beverage Services | 185,100 | 34.6% | -253,100 | -26.0% |
| Recreation and Entertainment | 60,600 | 18.6% | -120,300 | -23.7% |
| Transportation | 36,200 | 14.4% | -88,700 | -23.6% |
| Travel Services | 13,200 | 43.6% | -10,200 | -19.0% |
Bonus Data – Strong Indications of Labour Shortages this Summer
Our new data supports the argument that rural tourism businesses—especially those close to urban areas—will face labour shortages this summer (based on looking at employment levels for 2020 and 2021 and compared them to the same month in 2019).
Tourism employment is down in all regions. But some regions have recovered more than others. The rural areas connected to cities (CMAs) and larger towns (CAs) have done the best, followed by the fringe areas of CMAs/CAs. Fringe areas are the smaller towns/villages that are not directly attached to larger centres but are considered part of the census metropolitan area/census agglomeration. Greely would be an example. It is part of the Ottawa CMA but not directly attached to the main urban area.
One reason the rural areas attached to urban centres might see labour shortages this summer is because overall employment in those areas has fully recovered and exceeded employment levels in 2019. Core regions still have less employment than in 2019. Part of this may be because of people moving from urban cores to exurban areas. (Although we don’t have hard evidence but these areas have seen greater growth in their overall labour force than other regions, which helps bolster the argument.) The rural areas attached to cities and towns also have the lowest unemployment rate of any region (5.9%). As of April, the overall unemployment rate was 8.4%. To sum up, the rural areas have seen the greatest recovery of tourism employment, employment across all industries has exceeded pre-pandemic levels, and the unemployment rates indicates that there is less slack the labour market of these regions.
For much more information on labour trends and projections, check out the Employment Tracker Tool: Tourism Employment Tracker (tourismhr.ca)
]]>The Atlantic Provinces Economic Council (APEC), together with Statistics Canada is presenting a virtual event: COVID-19 in Atlantic Canada – One Year Later: A Conversation with Chief Statistician Anil Arora.
The May 12th10a.m. event will feature a fireside chat between the Chief Statistician, Anil Arora and President & CEO of APEC, David Chaundy.
The discussion will focus on three themes, all with an Atlantic regional lens:
– COVID-19 regional impact and economic recovery;
– How Statistics Canada supported Canada’s pandemic response; and
– The vital role of the census for data and decision-making.

Prepared by Tourism HR Canada – May, 2021
‘Snapshot’ of the from the latest Labour Force Survey data, which is released once a month by Stats Canada.
Note, the seasonally adjusted data shows employment across all industries—not just tourism—dropping by 207,000. The unadjusted data shows a drop of “only” 73,700. The gap between adjusted and unadjusted data is particularly large this month. Usually, employment starts to increase in the spring as business begin to prepare for the summer. Because the usual trend at this time of year is an employment increase, any decrease is going to be significantly amplified when seasonal adjustments are applied. Noted for context, when reading the headlines below.
Employment across all industries fell by 73,700. Tourism employment fell by 68,900, a decrease of 4.4% from March. The tourism sector accounted for 93.5% of employment losses.
Every tourism industry group saw employment decrease. Travel services was hit particularly hard this month. Employment in that industry group dropped by 24.0%.
Despite the drop in employment, the tourism sector unemployment rate actually declined. This was driven by declining unemployment rates in the food and beverage and travel services industry. This seems counter intuitive but it tells us that former worker were not actively seeking new employment during the month of April. Considering current lockdown conditions, that is fairly understandable.
| Industry | Employment Change
from March |
Percent Employment Decrease | Unemployment Rate |
| All Industries | -73,700 | – 0.4% | 8.4% |
| Tourism Sector | -68,900 | -4.4% | 11.3% |
| Accommodations | -3,700 | -3.2% | 16.2% |
| Food and Beverage Services | -47,400 | -6.4% | 11.6% |
| Recreation and Entertainment | -3,400 | -0.9% | 13.1% |
| Transportation | -500 | -0.2% | 6.7% |
| Travel Services | -13,900 | -24.0% | 7.4% |
To keep track of employment trends and the impact of COVID on tourism labour, with data you can easily tailor to your needs check out: Tourism Employment Tracker (tourismhr.ca)
]]>Our partners at Tourism Industry Association of Canada have released their March snapshot of the State of Tourism in Canada.
These dashboard reports provide a monthly snapshot of recent global, regional and domestic tourism health and economic updates, and insights on the impact of COVID-19 on the travel and tourism industry’s path to recovery. Insights are derived from a review of myriad global and Canadian media sources, associations, consultancies, and expert opinion from the tourism industry and government. Key drivers taken into consideration include tourism channels such as source markets, airlines, accommodations, tourism businesses, tour operators, OTAs, and travellers.
]]>